Fact Book 2026–2027
Discover & Develop Your Divine Design
Board of Trustees
- Dr. Doug Witherup Chairman
- Dr. M. Wayne Blackburn Vice Chairman
- Rev. John Jordan Secretary
- Dr. Kent Ingle President
- Rev. Tommy Barnett Chancellor
- Rev. Abner Adorno
- Rev. Roger Archer
- Rev. Luke Barnett
- Dr. Mark Batterson
- Rev. Mark Jakelsky
- Dr. Steve Mason
- Rev. Ricardo Orsini
- Dr. Jeffery Portmann
- Mr. Matthew Potter
- Rev. Nate Puccini
- Dr. Terry Raburn
- Rev. Judy Rachels
- Rev. Ray Rachels
- Dr. Terrell Roberts
- Dr. Gabriel Salguero
- Rev. Robert Sandler
- Rev. Alex Seeley
- Dr. Scott Williams
About SEU
Southeastern University is a Christ-centered institution of higher learning. We are committed to equipping the next generation of leaders so that they can go into the world as influential servant leaders in their careers and their communities.
Our Core Values
- A university absolutely committed to Christ-like formation
- A university of educational breadth and depth
- A university of faculty distinction
- A university that thinks globally
- A university committed to serving human needs in our community and in communities around the world
- A university characterized as a community of grace
- A university that is student-focused at all times
Our Five-Year Plan
To create a university of curricular, co-curricular and experiential excellence with a faculty of distinction, diverse student population, strong financial base, and a culture of high performance and quality.
View the University Strategic Plan (employee access required).
History of SEU
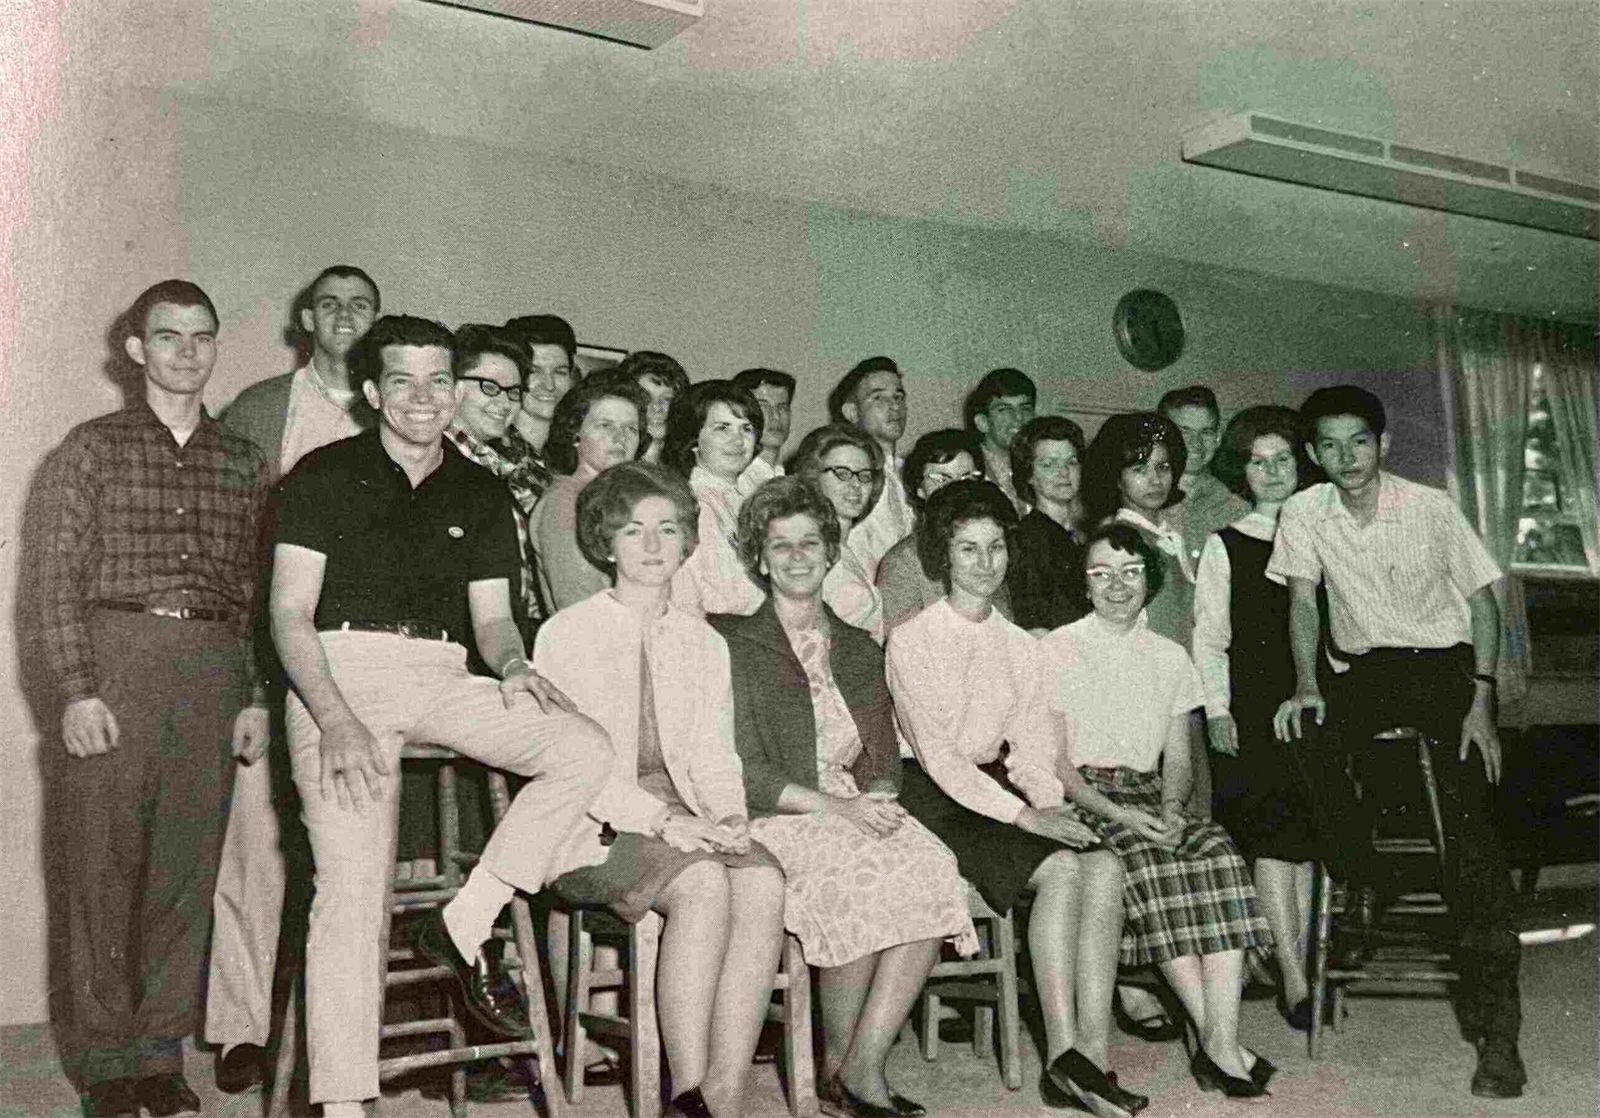
Since our founding in 1935, Southeastern University’s global impact has been marked by a deep commitment to the integration of faith, learning and service. Each student’s divine design is nurtured and unleashed through the investment of faculty and staff, relationships within the community, the rigor of scholarship, diverse learning experiences, and the discipline of spiritual formation, which propels students into a lifetime of serving the world in the Spirit of Christ.
SEU News
Missions
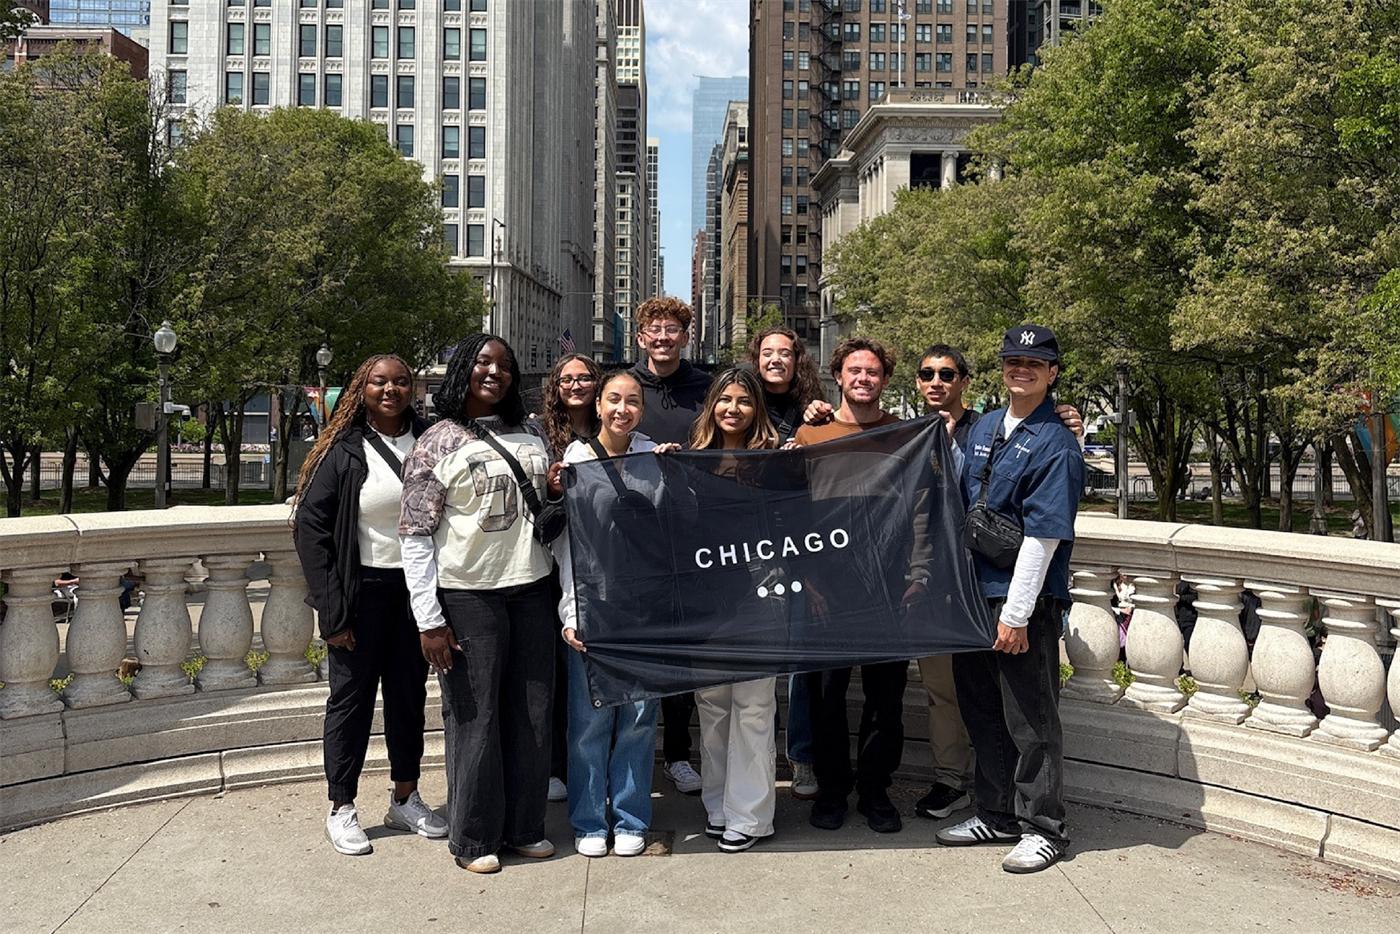
Through SEU Missions, we have created space for students to step into the domestic and international mission fields. See our latest stats and stories from recent trips.
Where SEU Missions Has Gone
2026-2027 Planned Trips
Dates and details for each trip are at seumissions.com/trips.
International (39)
- Argentina
- Asia Minor
- Asia Pioneering
- Baltics
- Brazil
- Bulgaria
- Cambodia
- Central Asia
- Colombia
- Czech Republic
- Dominican Republic
- Ecuador
- Ghana
- Guatemala
- Himalayas
- Honduras
- Ireland
- Jamaica
- Japan
- Madagascar
- Mexico
- Mozambique
- Nicaragua
- North Africa
- Norway Spring Break
- Norway Summer
- Romania
- Sahara Desert
- Silk Road
- South Africa
- South Asia
- Southeast Asia
- Spring Break Mystery Trip
- Summer Mystery Trip
- Taiwan
- Tanzania
- Uganda
- Zambia
- Zanzibar
Domestic (6)
- Alaska
- Appalachian Trail
- Brooklyn, NY
- Los Angeles, CA
- Puerto Rico
- Short Creek, UT
2025-2026 Mission Trip Locations
The 2025–26 trips as reported by SEU Missions in October 2026. The 2025–26 Fact Book listed the trips planned for that year, so its list differs.
International (34)
- Asia Islands
- Asia Minor
- Asia Pioneering
- Brazil
- Bulgaria
- Cambodia
- Cuba
- Dominican Republic
- Ecuador
- Ghana
- Greece
- Guatemala
- Himalayas
- Italy
- Jamaica
- Madagascar
- Mexico
- Middle East
- Mozambique
- Nicaragua
- North Africa
- Norway
- Norway Summer
- Romania
- Sahara Desert
- Silk Road
- South Africa
- South Asia
- South Korea
- Southeast Asia
- Tanzania
- Thailand
- Zambia
- Zanzibar
Domestic (6)
- Alaska
- Brooklyn, NY
- Los Angeles, CA
- Miami, FL
- Puerto Rico
- Short Creek, UT
The SEU Missions page may show different totals. Colombia and Uganda trips were planned for 2025-2026 but redirected, so they are not listed here.
2024-2025 Mission Trip Locations
International (30)
- Amsterdam
- Asia Islands
- Bahamas
- Bulgaria
- Cambodia
- Colombia
- Costa Rica
- Cuba
- Greece
- Guatemala
- Himalayas
- Ireland
- Jamaica
- Jungle Mystery
- Madagascar
- Mexico
- Middle East
- Nicaragua
- North Africa
- Norway
- Paris
- Philippines
- Silk Road
- South Africa
- South Asia
- Southeast Asia
- Tanzania
- Uganda
- Zambia
- Zanzibar
Domestic (6)
- Alaska
- Brooklyn, NY
- Chicago, IL
- Miami, FL
- Puerto Rico
- West Coast Road Trip (Los Angeles, CA and Short Creek, UT)
Points of Excellence
There’s always something new and exciting happening at SEU! Here are a few notable highlights from the past year. Discover more at SEU.edu/news.
- Now Enrolling: RSG at SEU Early Childhood Center
- SEU Launches a PhD in Kinesiology
- SEU Worship Nominated for Two 2026 Dove Awards
- SEU Continues Record Growth with Historic Fall 2026 Enrollment & National Rankings
- SEU Worship Releases New Album, Found In The Field
- SEU Welcomes University of Valley Forge Students
- SEU Earns National Association of Schools of Music Accreditation
- SEU Appoints New Provost and Chief Financial Officer
- SEU Receives GiveWell Community Foundation Grant to Support Early Childhood Center
- New Abridged Bachelor’s in Computer Science
- SEU President’s Report 2025
- 2026–2027 Tuition to Remain Steady for All Students
- SEU Receives $10 Million Grant to Launch The Kingdom Alliance
- ACPL Receives $1.12 Million Grant from the Department of Education
- SEU Partners with PragerU to Launch History Course Series
Enrollment Statistics
SEU was once again ranked in the top 1% of the fastest-growing private doctoral institutions in the nation by The Chronicle of Higher Education (2026–27 Almanac; SEU news release). We welcome students from across the country and around the world.
Enrollment Over Time
2026 Fall New Undergraduate Enrollment By Classification
- 1,785 First-time undergraduates
- 711 Transfer students
- 4,756 New dual-enrolled students
- 69.6% First-year retention, fall 2025 cohort

New and returning are as the census records them. New dual-enrolled students have a dual-enrollment application for this year, so some took SEU courses in an earlier term.
Continuing students who changed program are in the upper chart’s totals and count as new students in the lower chart. The lower chart counts every new student: its Partnerships bar adds graduate and post-secondary students, and its Pre-Collegiate Studies bar can include a student who is not dual-enrolled.
| Location | Panel | Group | Count |
|---|---|---|---|
| Lakeland UG | New undergraduates | Continuing, changed program | 15 |
| Lakeland UG | New undergraduates | First-time | 925 |
| Lakeland UG | New undergraduates | Non-degree | 1 |
| Lakeland UG | New undergraduates | Re-applicant | 8 |
| Lakeland UG | New undergraduates | Transfer | 224 |
| Online UG | New undergraduates | Continuing, changed program | 91 |
| Online UG | New undergraduates | First-time | 224 |
| Online UG | New undergraduates | Non-degree | 4 |
| Online UG | New undergraduates | Re-applicant | 22 |
| Online UG | New undergraduates | Transfer | 164 |
| Partnerships | New undergraduates | Continuing, changed program | 5 |
| Partnerships | New undergraduates | First-time | 58 |
| Partnerships | New undergraduates | Non-degree | 53 |
| Partnerships | New undergraduates | Re-applicant | 6 |
| Partnerships | New undergraduates | Transfer | 20 |
| Sites UG | New undergraduates | Continuing, changed program | 35 |
| Sites UG | New undergraduates | First-time | 578 |
| Sites UG | New undergraduates | Re-applicant | 25 |
| Sites UG | New undergraduates | Transfer | 303 |
| Divinity subscription | New and returning students by location | New Student | 76 |
| Divinity subscription | New and returning students by location | Returning Student | 128 |
| Graduate | New and returning students by location | New Student | 449 |
| Graduate | New and returning students by location | Returning Student | 784 |
| Lakeland UG | New and returning students by location | New Student | 1,173 |
| Lakeland UG | New and returning students by location | Returning Student | 1,325 |
| Online UG | New and returning students by location | New Student | 505 |
| Online UG | New and returning students by location | Returning Student | 501 |
| Partnerships | New and returning students by location | New Student | 204 |
| Partnerships | New and returning students by location | Returning Student | 516 |
| Pre-Collegiate Studies | New and returning students by location | New Student | 4,757 |
| Pre-Collegiate Studies | New and returning students by location | Returning Student | 2,494 |
| Sites UG | New and returning students by location | New Student | 941 |
| Sites UG | New and returning students by location | Returning Student | 1,283 |
Enrollment By Major
Ethnic Minority Percentage

Ethnic minority means Hispanic or Latino of any race, Black or African American, Asian, American Indian or Alaska Native, Native Hawaiian or Other Pacific Islander, or two or more races. U.S. nonresidents and students of unknown race are left out of the total.
Few students were recorded as two or more races before 2018, so part of the rise from 2017 to 2019 (up to about 3 points) reflects that change in recording.
2016 to 2023 are the printed figures; 2016 and 2017 were figured another way and would be 37.8% and 36.2% on this basis. The 2024–25 and 2025–26 books showed 35.3% for 2016; 35.5% is the 2020–21 to 2023–24 printed value (2,062 of 5,804).
From 2024 the share is computed from the same race counts as Enrollment Over Time, whose Other or unknown row combines groups that count as minority with groups that do not, so it cannot be rebuilt from that chart’s groups alone. The 2024–25 and 2025–26 fact books showed 38.3% for 2024 and 39.4% for 2025, counting every student in the total (2024 also used an older race coding).
| Year | Percent |
|---|---|
| 2016 | 35.5 |
| 2017 | 37.1 |
| 2018 | 39.5 |
| 2019 | 42.4 |
| 2020 | 41.9 |
| 2021 | 43.3 |
| 2022 | 42.0 |
| 2023 | 44.4 |
| 2024 | 44.5 |
| 2025 | 43.9 |
| 2026 | 44.7 |
Enrollment By State/ U.S. Territory and International Enrollment
On-Campus Enrollment

Falls 2016 to 2023 are as printed in the earlier fact books, except where noted; later falls are counted from the census. Fall 2022 commuters are 650, as printed in the 2022–23 and 2023–24 Fact Books; the 2024–25 and 2025–26 editions showed 620.
Fall 2026’s 2,508 counts students at the Lakeland traditional campus, so it differs slightly from the 2,498 Lakeland UG in Enrollment Over Time.
| Year | Residents | Commuters |
|---|---|---|
| 2016 | 1,792 | 995 |
| 2017 | 1,637 | 1,111 |
| 2018 | 1,721 | 1,133 |
| 2019 | 1,615 | 806 |
| 2020 | 1,464 | 1,333 |
| 2021 | 1,577 | 743 |
| 2022 | 1,609 | 650 |
| 2023 | 1,584 | 627 |
| 2024 | 1,555 | 688 |
| 2025 | 1,562 | 661 |
| 2026 | 1,821 | 687 |
Academics
Academic Programs
SEU offers more than 120 degree programs at the associate, bachelor’s, master’s, and doctoral levels.
-
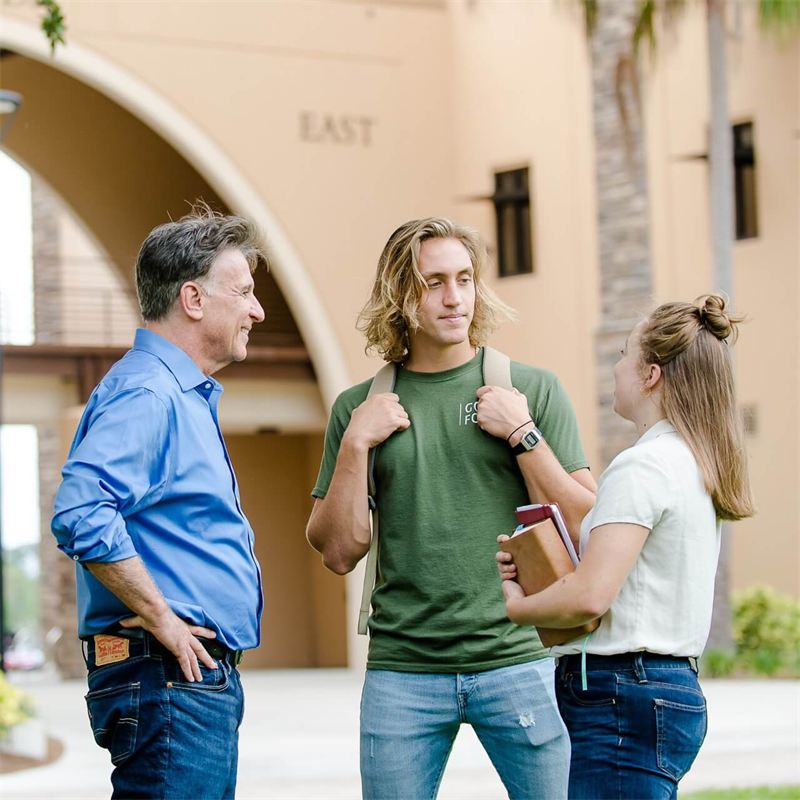
Barnett College of Ministry & Theology
View Programs -
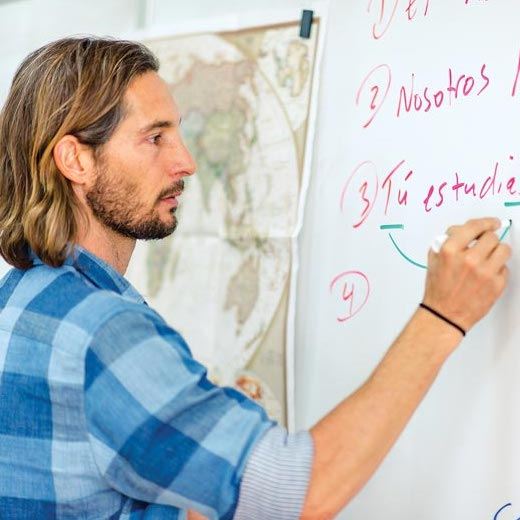
College of Behavioral & Social Sciences
View Programs -
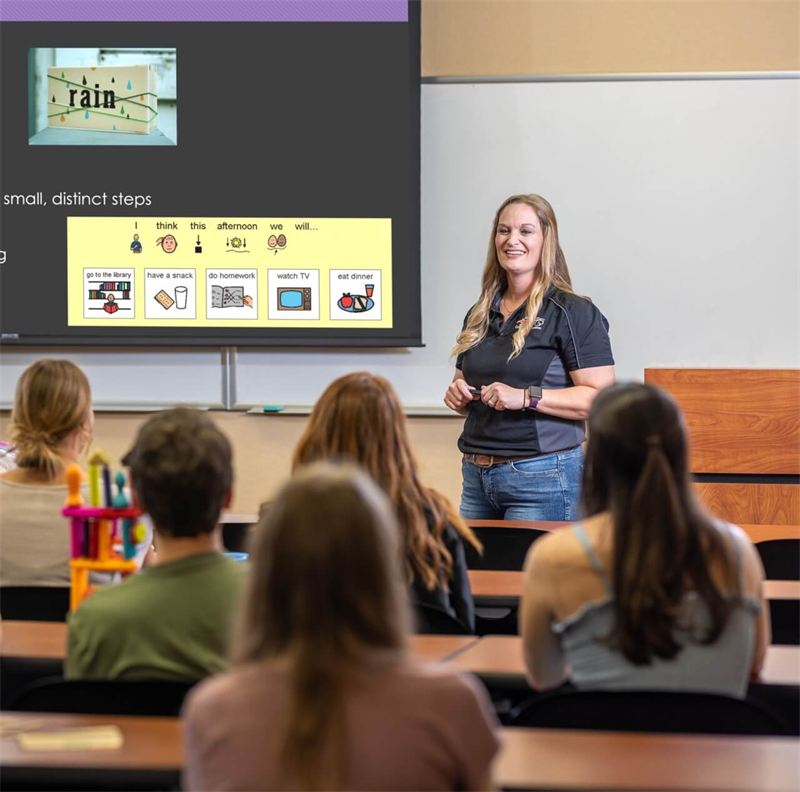
College of Education
View Programs -
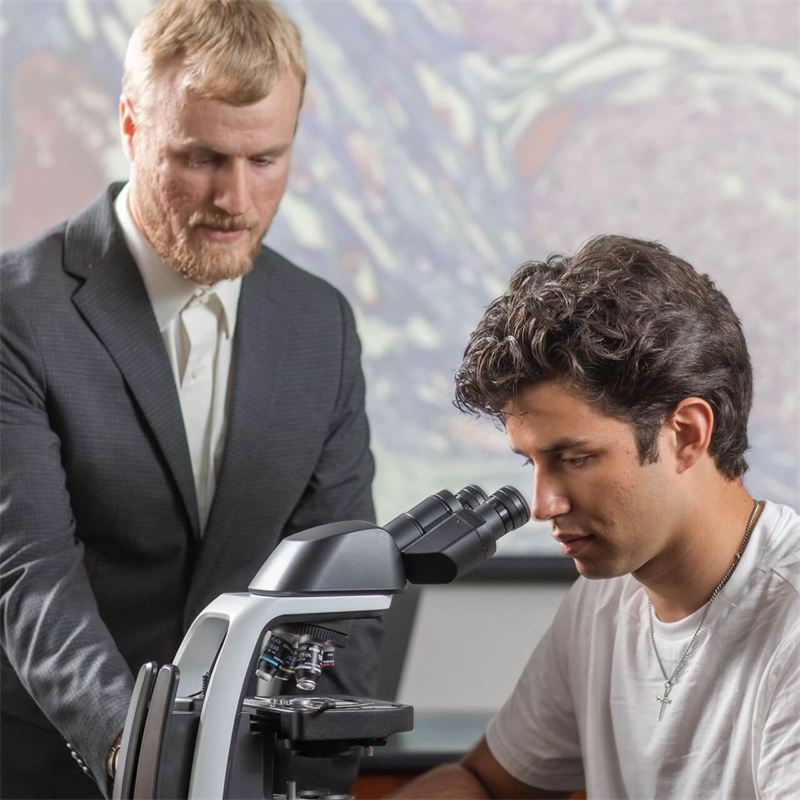
College of Natural & Health Sciences
View Programs -
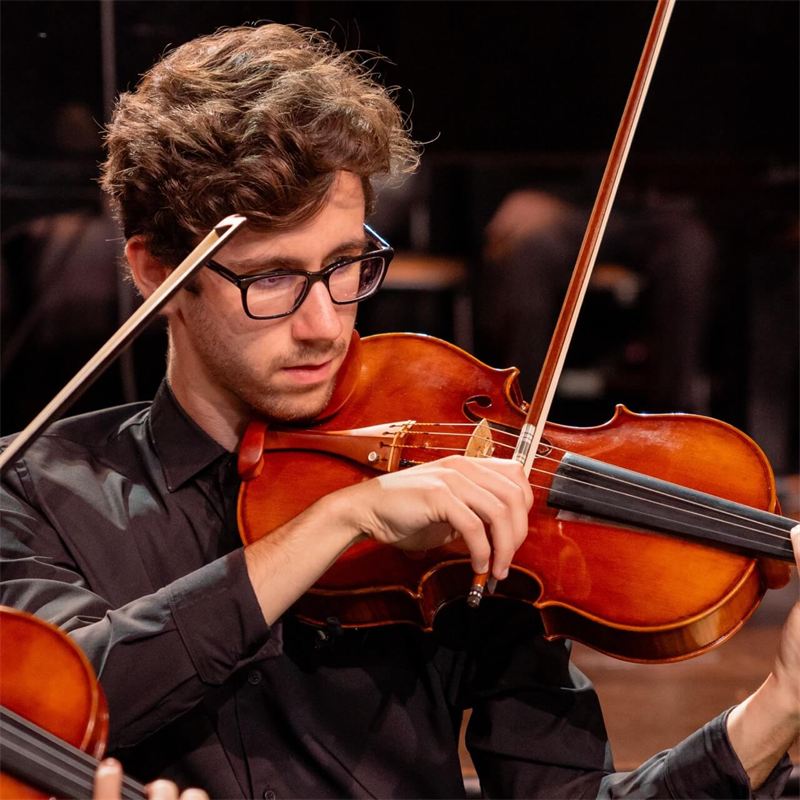
College of Truth, Beauty & Culture
View Programs -

Jannetides College of Business, Communication & Leadership
View Programs -

School of Trades
View Programs -

SEU Tech
View Programs
School of Honors
The SEU School of Honors is designed for students with a record of academic success who would like to be challenged in preparation for their careers or continued graduate studies.
- 543 Honors graduates In the 18 years since the School of Honors began

Yearly School of Honors Enrollment

Enrollment counts students with the School of Honors flag who registered for a fall course, as earlier fact books did, so it includes students who completed honors as undergraduates and are now in SEU graduate programs.
Average GPA is taken as of when the figure was compiled. Students with no GPA yet or a GPA below 2.0 are left out, so the group can differ from the enrollment count.
| Year | Enrollment | GPA |
|---|---|---|
| 2016 | 183 | 3.76 |
| 2017 | 195 | 3.82 |
| 2018 | 207 | 3.80 |
| 2019 | 217 | 3.80 |
| 2020 | 204 | 3.83 |
| 2021 | 214 | 3.80 |
| 2022 | 232 | 3.70 |
| 2023 | 237 | 3.79 |
| 2024 | 248 | 3.80 |
| 2025 | 226 | 3.76 |
| 2026 | 210 |
Recent Honors Projects
Honors graduates complete a thesis, a creative project or a portfolio. Three recent theses, chosen by the School of Honors to show its interdisciplinary range:
- “Plenty of Heart and Plenty of Hope”: An Analysis of Social and Historical Implications in Post-WWII Western Musical Films
- Targeting Malaria Using RTS,S/AS01 Liposome-Based Therapy in Combination With Cryptolepis sanguinolenta
- Called for Such a Time as This: The Role of Women in Church Leadership and the Future of Ministry
Faculty
Our SEU faculty are Christian educators who lead by example, providing not only academic knowledge but also spiritual support and mentorship to students.
Faculty Rank

| Rank | Count |
|---|---|
| Professor | 49 |
| Associate Professor | 37 |
| Assistant Professor | 33 |
| Instructor | 2 |
| Lecturer | 1 |
Employees

Faculty are the employees HR classifies as full-time instructional staff, the group SEU reports to IPEDS Human Resources. They include the teachers at SEU's secondary school, Pathways School of Excellence; deans and other staff who also teach are counted in their own categories.
Adjuncts include those Paycom lists as Temporary, which the 2025–26 edition left out.
| Category | Count |
|---|---|
| Adjuncts | 691 |
| Teaching Faculty | 191 |
| Faculty | 129 |
| Professional | 259 |
| Executive | 100 |
| Technical | 72 |
| Clerical | 38 |
Instructional Faculty Demographics

Race and ethnicity come from Paycom. The 2025–26 chart showed American Indian or Alaska Native separately.
| Gender | Ethnicity | Count | Share |
|---|---|---|---|
| Female | Asian | 2 | 3% |
| Female | Black or African American | 5 | 7% |
| Female | Hispanic or Latino | 11 | 16% |
| Female | Other or unknown | 3 | 4% |
| Female | White | 49 | 70% |
| Male | Asian | 1 | 2% |
| Male | Black or African American | 6 | 10% |
| Male | Hispanic or Latino | 4 | 7% |
| Male | White | 47 | 81% |
Class Size
Alumni
Alumni Relations
The influence of Southeastern University’s alumni spans the globe. See what our graduates have accomplished since their time with SEU.
- 25,410 Graduates
- 28,063 Degrees & certificates awarded

Outcomes
Retention and graduation follow each entering class of first-time, full-time freshmen. Of the students who started in fall 2025, 69.6% returned the next fall. Of those who started in fall 2020, 48.8% earned an SEU undergraduate degree or certificate within six years.
SEU Network
- 41 States & territories
- 217 Partner Sites
- 12 Regional Campuses
- 11 International Partners
Partner Sites
SEU has 229 sites across the United States: regional campuses and partner sites.
Learn More about partner sites
U.S. Locations
International Partnerships
Students in other countries study with SEU online, some through its 11 international partners:
- Abundant Life International School (Phnom Penh, Cambodia)
- Beddington Pentecostal Church (Calgary, Alberta, Canada)
- Community Fellowship Centre
- Experience Church (Calgary, Alberta, Canada)
- Instituto Universitario Franco Inglés de México (Mexico)
- Kyoto International University (Kyoto, Japan)
- Oasis City Church (North Cowichan, British Columbia, Canada)
- Okinawa Christian School International (Okinawa, Japan)
- Universitatea Moldo-Americană (Chisinau, Moldova)
- Urban Tribes (uMhlanga, KwaZulu-Natal, South Africa)
- Watoto Christian Hall (Kampala, Uganda)
High Impact Sites/Partnerships
- Bayside Community Church, Bradenton, FL
- Calvary Christian Center, Ormond Beach, FL
- Celebration Church, Jacksonville, FL
- Christ Fellowship, Palm Beach Gardens, FL
- Christian Life Center, Ft Lauderdale, FL
- Classical Conversations Plus, Southern Pines, NC
- Countryside Christian Center, Clearwater, FL
- Dream City Church, Phoenix, AZ
- Elevation Church, Matthews, NC
- Emmanuel Christian Center, Spring Lake Park, MN
- Faith Assembly of God, Orlando, FL
- Grace Church, Houston, TX
- Grace City Church, Lakeland, FL
- Journey Church, Kenosha, WI
- Meadowbrook Church, Ocala, FL
- Motion Church, Puyallup, WA
- Multiply Church, Concord, NC
- New Life Church, Conway, AR
- Ohio Ministry Network, Columbus, OH
- OneHope, Pompano Beach, FL
- People's Church, Oklahoma City, OK
- The Belonging Co. Church, Inc, Franklin, TN
- The Church at Chapelhill, Douglasville, GA
- Thriving Churches, Int'l, Roseville, CA
- Valley Creek Church, Flower Mound, TX
- Vous Church, Miami, FL
Pre-Collegiate Studies
Pre-Collegiate Studies brings SEU courses to high school students through dual enrollment. Its 7,251 students in fall 2026 were 47.9% of SEU’s fall enrollment.
- 7,251 Students, fall 2026
- 4,756 New dual-enrolled students
- 162 Partner schools & programs
- 18 States with partners
Enrollment Over Time

Fall census headcount, counting each student once. Since fall 2024 Pre-Collegiate Studies counts every dual-enrolled high school student. Earlier falls are restated to that definition, so they are higher than in Enrollment Over Time, which keeps the counts made at the time, when many dual-enrolled students were counted under other locations.
| Year | Students |
|---|---|
| 2018 | 2,105 |
| 2019 | 3,112 |
| 2020 | 2,962 |
| 2021 | 2,816 |
| 2022 | 3,899 |
| 2023 | 4,464 |
| 2024 | 5,387 |
| 2025 | 6,626 |
| 2026 | 7,251 |
Where Students Study

Each student is counted once, at the location the fall census records. Dual-enrollment partner schools are high schools that partner with SEU; partner programs are partnerships such as Classical Conversations Plus. SEU Network sites are regional campuses and partner sites that also host Pre-Collegiate Studies students.
| Setting | Students |
|---|---|
| Dual-enrollment partner schools | 3,182 |
| Partner programs | 2,484 |
| Online | 1,130 |
| Lakeland campus | 136 |
| SEU Network sites | 303 |
| Outside the United States | 16 |
Partner Schools & Programs
5,666 students studied at 162 partners in 18 states: 119 dual-enrollment partner schools and 43 partner programs.
U.S. Partner Locations
Financials
Financial Aid
Financial Aid Highlights
- 99% of on-campus undergraduate students receive financial aid.
- $23,856 average award amount
- $37.7M in financial aid awarded in 2025-26
Tuition & Fees
2026-2027
Cost of Attendance Comparison
See how SEU’s estimated yearly cost of attendance for a full-time, first-time undergraduate living on campus compares with other private universities in 2024–25. Cost of attendance, as reported to IPEDS, includes tuition and fees, food and housing, books and supplies, and other expenses. The University of Valley Forge, shown for that year, ended instruction at the end of summer 2026.

| School | Assemblies of God | Annual cost |
|---|---|---|
| Florida Southern College | $63,200 | |
| Palm Beach Atlantic University | $62,342 | |
| Vanguard University | Yes | $60,445 |
| Southeastern University | Yes | $53,480 |
| Oral Roberts University | $51,850 | |
| Northwest University | Yes | $51,367 |
| University of Valley Forge | Yes | $47,032 |
| North Central University | Yes | $46,710 |
| Liberty University | $44,489 | |
| Nelson University | Yes | $42,412 |
| Evangel University | Yes | $42,190 |
| Lee University | $39,460 |
Main Campus Information
Fire Athletics
Southeastern University is a member of the National Association of Intercollegiate Athletics (NAIA) and competes in The Sun Conference, with wrestling in the Southern States Athletic Conference. Below are just some of the many highlights from the 2025–2026 year.
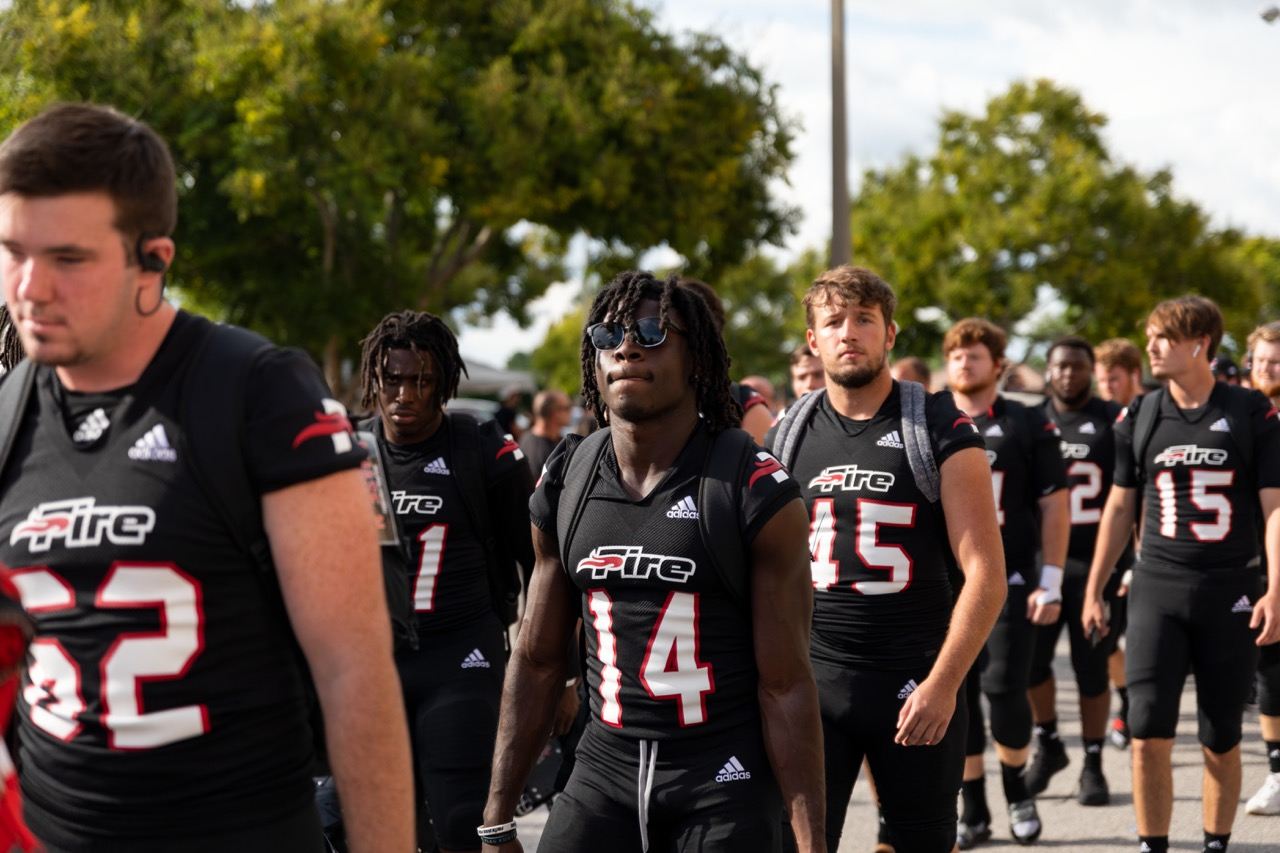
- Fire Women Capture Seventh-Straight Sun Conference Track & Field Championship
- Fire Women Win Sixth-Straight Sun Conference Indoor Track & Field Title
- Fire Baseball Captures Seventh Sun Conference Tournament Title, Returns to NAIA World Series
- Fire Men’s Basketball Earns At-Large Bid to NAIA National Championship
- SEU Cheer Takes Fourth at UCA Nationals
- Brooks Qualifies for NAIA Cross Country National Championship
- Fire Football Makes History with First Postseason Win
- Fire Men’s Golf Finishes Third at Sun Conference Championship
- Fire Men’s Tennis Returns to NAIA National Semifinals
- Fire Softball Finishes Historic Season as NAIA National Runner-Up
- Fire Women’s Basketball Wins Eighth Sun Conference Title and Seventh Tournament Crown
- Fire Women’s Golf Finishes Eighth at NAIA National Championship
- Fire Women’s Soccer Sweeps Sun Conference Regular-Season and Tournament Titles
- Fire Women’s Tennis Clinches First Sun Conference Title
- Bonomi Named Sun Conference Player of the Year and NAIA All-American
- Fire Wrestling Finishes Sixth at NAIA Championship; Four Named All-Americans
Campus Housing & Capacity
SEU students who live on our Lakeland campus enjoy a wide variety of amenities, as well as continual support from residence life staff and opportunities to connect with the campus community.
View Housing & Dining Information

Falls 2016 to 2023 are as printed in the earlier fact books, except where noted; later falls are counted from the census. Fall 2022 commuters are 650, as printed in the 2022–23 and 2023–24 Fact Books; the 2024–25 and 2025–26 editions showed 620.
| Year | Residents | Commuters | Capacity | Occupancy |
|---|---|---|---|---|
| 2016 | 1,792 | 995 | 1,843 | 97% |
| 2017 | 1,637 | 1,111 | 1,842 | 89% |
| 2018 | 1,721 | 1,133 | 1,836 | 94% |
| 2019 | 1,615 | 806 | 1,834 | 88% |
| 2020 | 1,464 | 1,333 | 1,699 | 86% |
| 2021 | 1,577 | 743 | 1,699 | 93% |
| 2022 | 1,609 | 650 | 1,791 | 90% |
| 2023 | 1,584 | 627 | 1,764 | 90% |
| 2024 | 1,555 | 688 | 1,818 | 86% |
| 2025 | 1,562 | 661 | 1,734 | 90% |
| 2026 | 1,821 | 687 | 1,877 | 97% |
Clubs & Organizations
SEU offers students multiple ways to get involved, connect with the community, and build skills.
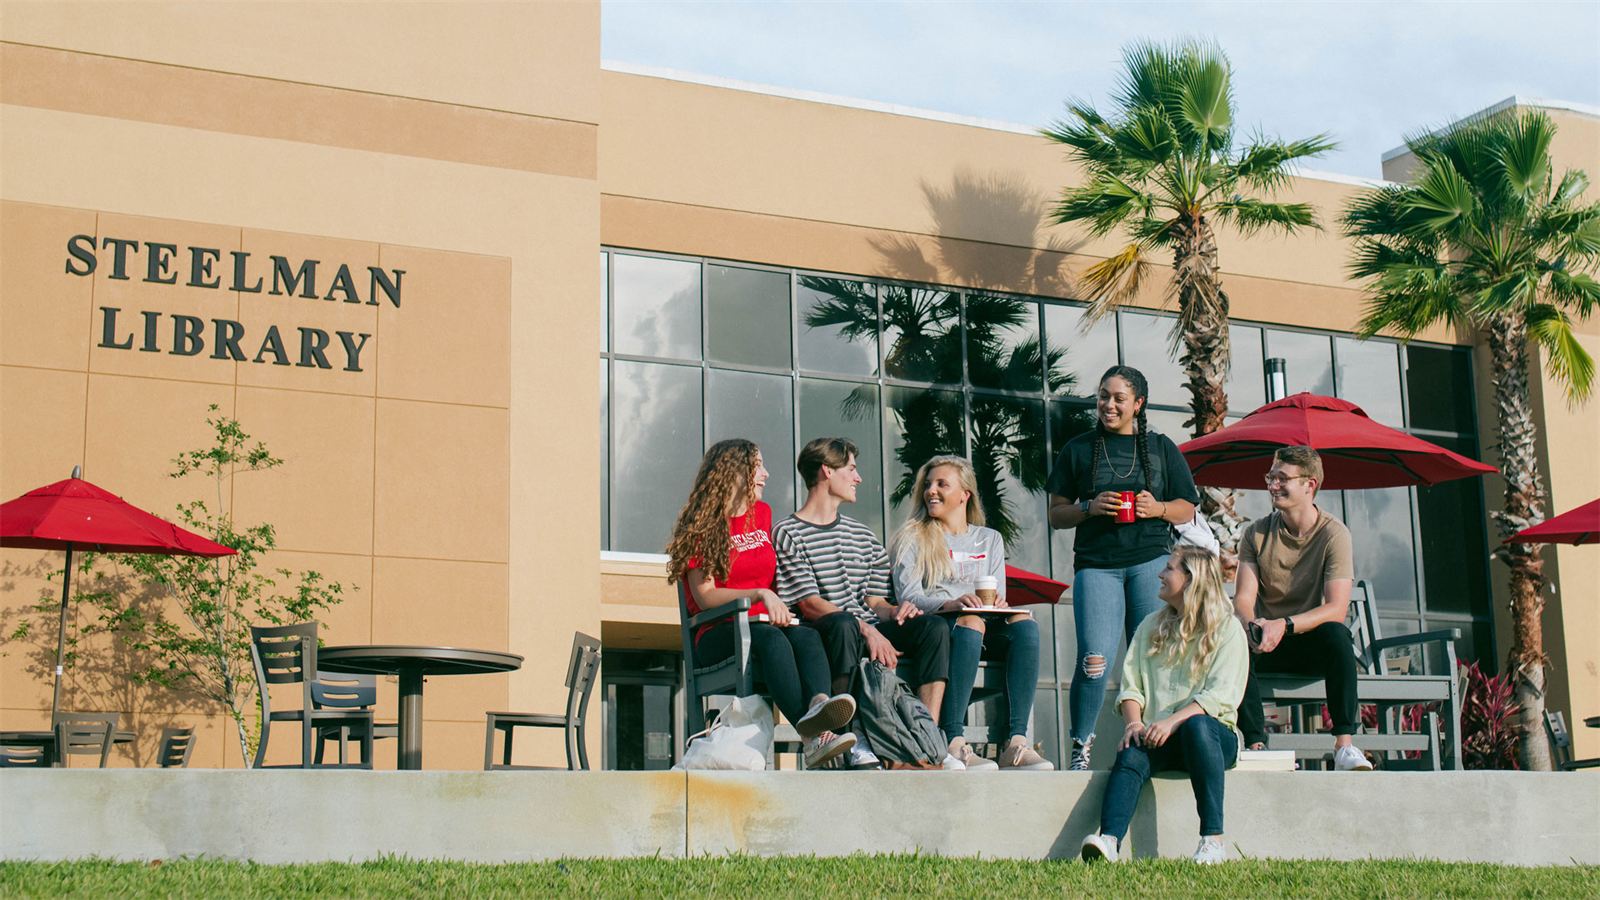
Library & Computer Resources
Resources are accessible on-campus within the Steelman Library; many are also available online.
- Books (print)
- 78,465
- Videos
- 2,536
- eBooks
- 306,324
- Online videos
- 65,603
- eNewspapers
- 9,247
- Other
- 2,485
- Total resources
- 464,660
- Computers for students
- 100
Student Support
SEU provides students with a wide variety of support services, making it easy to find the help they want and the resources they need.